As you may already know, there is a NES game called Baseball which, like its name suggests, is about baseball. Even 30+ years after its release, the two-player mode is still a lot of fun to play. After a staggering defeat against a friend, I decided to gain insight about the game to better understand the mechanics, particularly on the batting side. In this blog post, I share my findings with the faith that it will help you defeat your friends.
Here is how this blog post is divided. In the first section, we will see how the timing affects the chance of landing a successful hit. We will also explore how the batter’s position affects these chances. In the second section, I will present a head-up display I’ve created that helps swinging the bat at the right moment. Finally, for readers curious about the technical details, the third section overview how I acquired the data from game simulations.

The original box art for Baseball
1. Understanding batting
Modeling
I was interested in capturing how the batter’s position and timing affected the outcome of the ball. There are many possible outcomes (e.g., foul, home run, outs) for a pitch, but the most interesting outcome to analyze is the base hit. For your information, a base hit is when the batter successfully hit the ball then make it safely to the first base.
To get insight on how the external variables (batter’s position and timing) affect the chance of landing a base hit, I created a machine learning model. Like my previous blog posts, I chose a gradient boosting model for simplicity. In my model, I only used these four external variables:
- thrown ball speed,
- ball’s vertical position on the screen when the batter starts to swing,
- batter’s horizontal position,
- and batter’s vertical position.
This model was trained on data acquired through simulation. Only regular pitches were simulated (no curve ball, fast ball or slow ball). Also, the batter is always on the right box.
For the curious, the details of this data gathering are shown in the third section of this blog post.
When to hit the ball?
To answer this question, I first looked at only one variable: the ball’s vertical position on the screen when the batter starts to swing. I fixed the other variables as default, i.e. the batter was at his starting (default) position and the ball was thrown at the average speed (72 mph). The ball’s vertical position is defined by the number of pixels from the top to the bottom of the screen (see Figure 1.1).
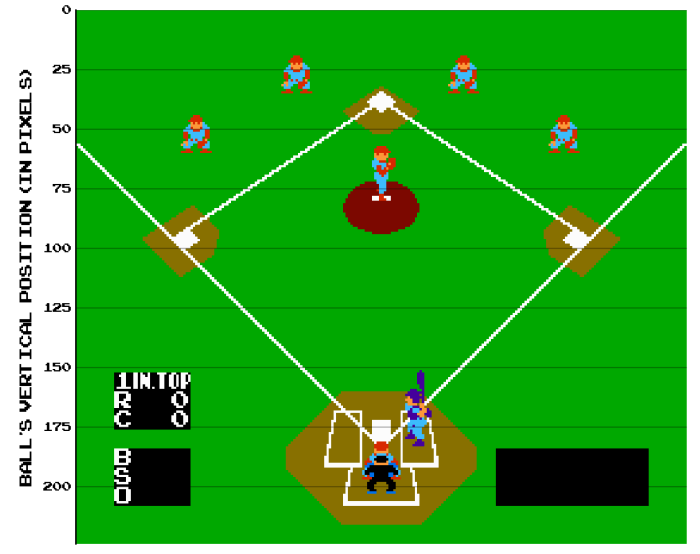
Figure 1.1 Ball’s vertical position applied to the actual TV screen.
Figure 1.2 shows the model’s results. As seen in the figure, if the ball is hit at the right moment (between 160 and 163 pixels), there is an almost 50% chance that the batter will make it to the first base safely. Another interesting feature is the plateau between 143 and 156 pixels. This means that in these conditions (default position, average ball speed), even if we fudge a little bit the swing and hit the ball at a suboptimal time, there’s still good chance to make it to first base (between 40% and 43%).
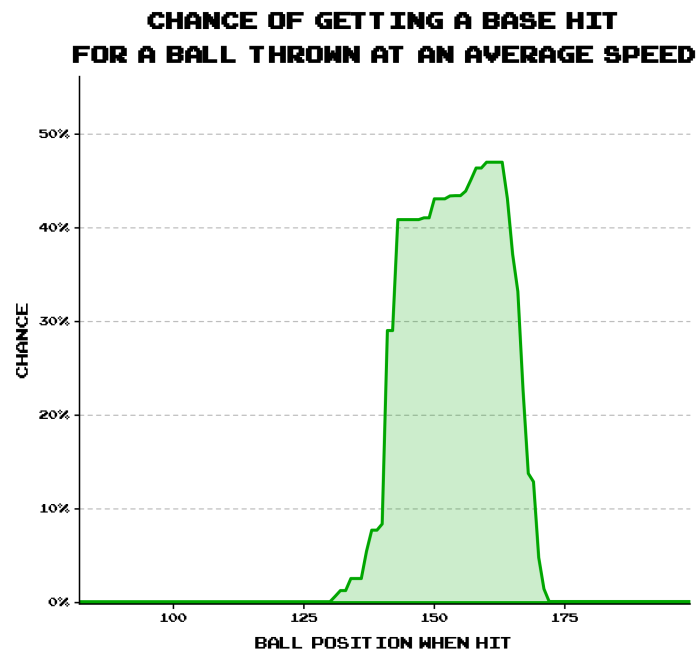
Figure 1.2 Chances of getting a base hit by ball position when the strike movement is started. In this example, the batter’s position is the default’s and the ball speed is the average (72 mph).
Figure 1.3 takes that same figure but applies it to the actual field. Watching figure 1.3, a rule of thumb would be to start pressing the swing button a brief moment before the ball reaches the home plate dirt (the brown lower area).
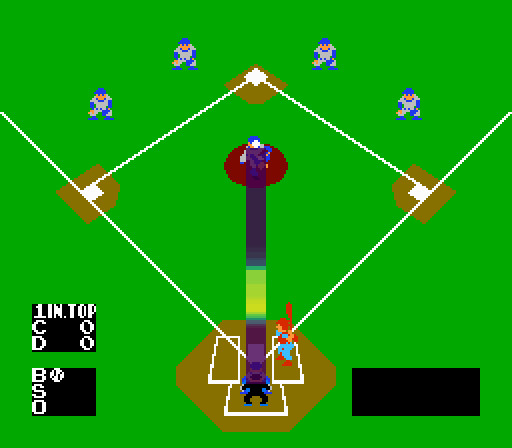
Figure 1.3 Same as fig. 1.2 but visualized as a colored stripe on the actual game field. Colors indicate the chance of landing a base hit with yellow being the highest chance and purple being the lowest chance.
I included animation 1.1 to help visualize what a ball hit at the optimal position looks like. In this example, the ball is thrown at the average speed and, with a successful hit, the player has plenty of time to reach the first base.
Animation 1.1: Example of a ball hit at the optimal moment.
Batter position
Now, we’ll look at how the batter’s position influences the chance of having a positive outcome. To help you visualize, figure 1.4 presents the chance of getting a base hit for 4 different batter positions. Again, we suppose the ball is thrown at the average speed (72 mph). The left graph is similar to figure 1.2 and shows the chance of getting a base hit according to the ball position when the batter starts to swing. The right graph displays the batter’s position within the batter’s box.
The green distribution represents the results using the batter’s default starting position, which is exactly what figure 1.2 showed. If we analyze the graph and compare these examples, we can conclude that the distributions vary lightly across all possible batter positions. Of course, being at the front, a batter in the red position will have to swing earlier. At the opposite, a batter in the blue position will have to swing its bat later. It’s also worth noting that a player in the red position has a much higher chance of getting a base hit (55%), but this chance stays high a slightly shorter amount of time.
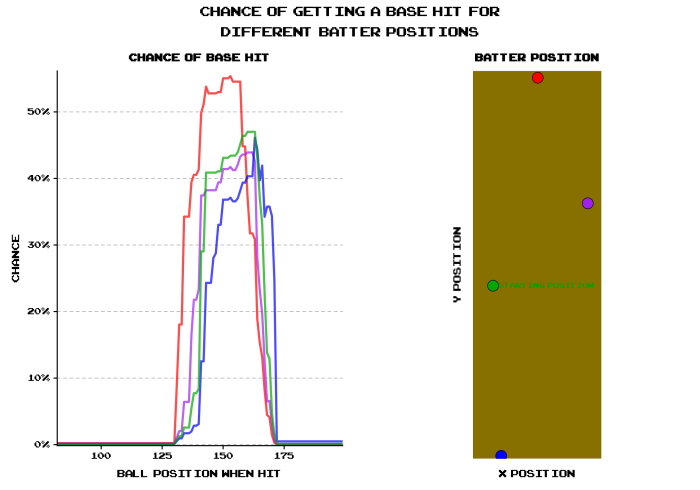
Figure 1.4 Chance of getting a base hit for 4 different batter positions. On the left graph, the chance of getting a base hit according to the ball position when struck is shown. On the right graph, the batter’s position is shown. Again, we suppose the ball is thrown at the average speed (72 mph).
In the previous examples, computations were all done with the assumption that the ball was thrown at a speed of 72 mph.
Now, what would be the optimal batter position at all possible ball speed levels?
For the next section, I have calculated, for every batter positions, the average chance of getting a base hit at every speed level. Doing so, I supposed that the batter swung the bat at the optimal ball vertical position on the screen (he’s a really good player).
In other words, I have calculated the best position on the batter box for an excellent player, independently of the ball speed.
Figure 1.5 shows the resulting average probabilities in a heat map. These probabilities were smoothed over the x and y positions using a generalized additive model to make the graph visually clearer and more appealing.
If we look at the figure, we see that the starting position isn’t optimal and has an average chance of getting a base hit of 51%. A player should back up a little bit to increase his chances to 53% or, if time permits should get at the front to improve the chances up to 58%!
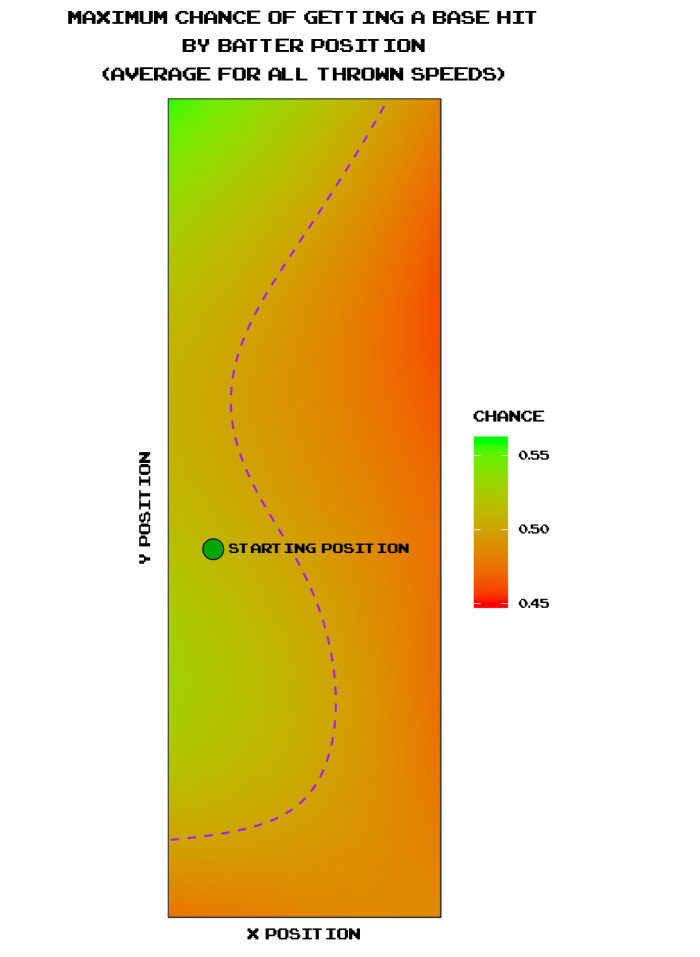
Figure 1.5 Chances of getting a base hit by batter’s position for an excellent player, independently of the ball speed. The greener area defined by the dashed purple line indicates that the chances are higher than 50%.
2. Head-up display
How can we apply these results to a real game?
I added some components to the interactive head-up display (HUD) in-game to help batting. For your information, a HUD is an interface which shows important information for the player. There was already a HUD represented by the black boxes on the left showing the number of points, balls, strikes and outs. I added two components to this HUD to indicate the chances of getting a base hit (vertical lines on the field and purple percentage in the lower right).
Figure 2.1 shows an example of this HUD for a batter at starting position. First, vertical lines were added to help with the swing timing. Similar to figure 1.3, these lines show the chances of getting a base hit when the batter starts swinging the bat at that ball vertical position (grey being the highest and black the lowest chances of getting a base hit). Secondly, the purple percentage in the black box on the lower right area was added to show the probability of a base hit if the ball is hit at the optimal moment (the lightest area in the vertical lines).
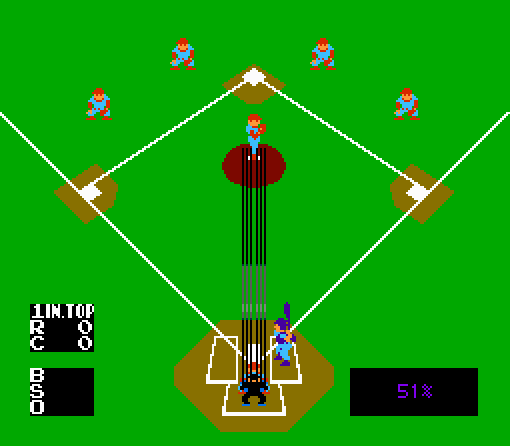
Figure 2.1 Head-up display that adds vertical lines in the middle and purple percentage in the lower right. The lines reflect figure 1.3 by showing the chances of getting a base hit (grey being the highest and black the lowest). The lower right purple percentage shows the highest probability when hit at the optimal moment.
What’s interesting about this display is its interactivity. It changes when the batter moves around its box to reflect the changes in the probability of getting a base hit. It also takes into consideration the thrown ball speed. Before the ball is thrown, the HUD displays an average for all ball speed levels. Of course, the display automatically update itself the moment the ball is thrown to reflect a more precise prediction.
This interactivity is shown in animation 2.1. In this example, the batter raises his average base hit chances by going to the front of his box. It is worth noting that the display is updated as soon as the pitcher throws the ball. Because the ball thrown is slower than the average (66 mph vs 72 mph) it shows that the batter should start swinging when the ball is closer to the home plate. Finally, the batter hits the ball and gets safely to first base.
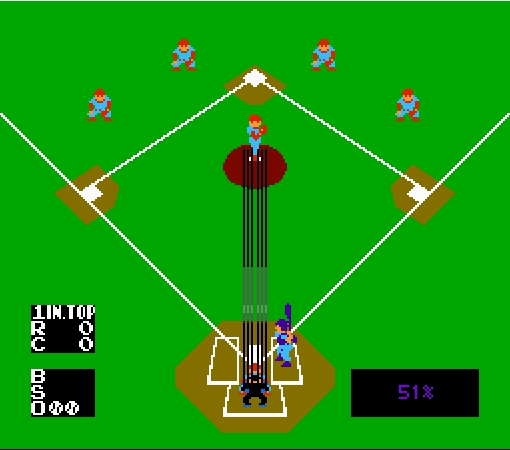
Animation 2.1 Example where the batter raises his base hit chances by going to the front of his box and successfully get to first base. Notice that the HUD automatically update when the player moves as well as when the ball is thrown.
3. Data acquisition
For the curious, I list here some of the technical details to clarify how I created these figures and animations.
Software Used
To interact with the game, I used the FCEUX emulator because it incorporates Lua which allows programming. The analyses were done using R. The connection between Lua and R was made possible thanks to the Rserve package in R. This way, Lua can call any R function. Finally, I used ImageMagick to convert the images into gifs.
Simulated Data
I simulated 8000 pitches and hits in a two-player game. Each time, I recorded what was the outcome of the hit (foul, fair, home run, out). For fair hits, I made the fielder throw the ball to first base and record whether or not the batter made it safe. I also varied the batter’s positions and ball’s positions before hitting to get a better sense of the optimal positions. I won’t go into details for this blog post, but the batter’s decisions were made using an Upper Confidence Bound algorithm using Random Forest. This algorithm helped prioritize the decisions which had the most uncertain outcome.
Unfortunately, for sake of simplification, I only simulated regular ball pitches. A regular ball pitch happens when the pitching player doesn’t press any direction on the NES controller’s pad (other ball pitches are curve ball, fast ball and slow ball). This means that all the probabilities and insights appearing on this blog post only apply on regular pitches. Still, I plan to generalize the work done here on all other pitches in a future blog post.
Another point is that all simulations used the same batter, who happens to be left-handed. Basic tests seem to indicate that the results still apply when mirrored to a right-handed batter.
Conclusion
Today, we revisited Baseball on the NES to better understand the batting dynamics. We learned about the optimal moment to start swinging the bat and the optimal position for the batter.
In the future, it would be interesting to analyze these variables and other settings such as different types of throws (e.g., curve ball and fast ball).


How did you simulate? I’d love to know how I can do one of these analysis. It would make my data science learning far more interesting. I don’t know machine learning though. I’d prefer to have the data and then analyze it. Is that possible. Is data out there at all to do stuff like this?