One of the most memorable NES game is Duck Hunt. Using the incredible NES Zapper (you know, that orange gun), the player has to aim and fire ducks on the screen. The classic game might not work anymore on your modern TV, but there are adapted versions on the market, including a version on the Wii U. In this blog post, we will analyze the flight of said ducks and how it evolves over the course of levels.
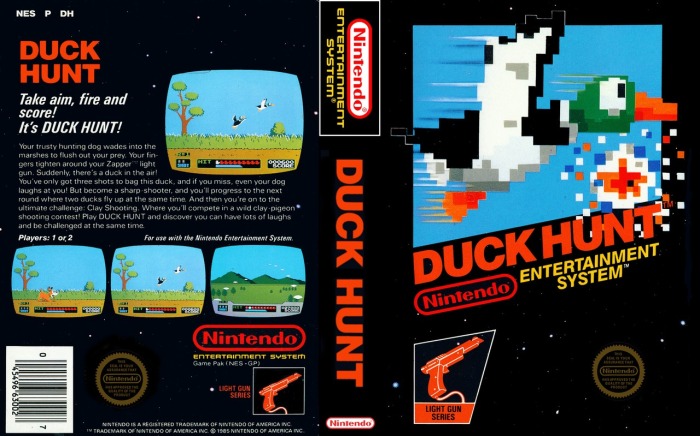
Figure 0.1 – Duck Hunt game box: Most people never saw this box, as most people had the one bundled with Super Mario Bros.
1. Duck Position
How does a typical duck flight look like? Figure 1.1 shows a composite sample of 50 ducks from the first level. From this animation, we learn that the ducks all come from the middle of the grass, fly in a similar fashion, but get spread out quite evenly after some seconds.
Figure 1.1 – Random sample of ducks: flight of 50 ducks on level 1, until the ‘FLY AWAY‘ box popped. code
1.1 Hitbox
This previous animation doesn’t take into account the hitbox of those ducks. Indeed, when the zapper’s trigger is pulled, a crude white box is drawn around the duck (see Figure 1.2 for an example), while all the rest of the screen goes black. Following the shot, the duck either goes down or continues its flight depending if it was a hit or not. At 60 frames per second, this action takes place in a fraction of second, faster than a duck’s wing beat.
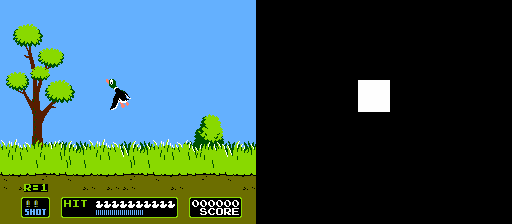
Figure 1.2 – Before and after pulling the trigger on the NES: the zapper has to detect enough light to register a hit.
Now, if we compile hitboxes for a sample of 1000 ducks on level 1, we get Figure 1.3. In this image, the density of ducks is shown by darker shades of purple. At first, the number of starting position is quite limited, but after 3-4 bounces on the side of the screen, we get a somehow uniform distribution. Of course, we always get more ducks on the middle of the screen than on the corners.
Figure 1.3 – Hitbox sample of 1000 ducks: flight of 1000 ducks on level 1. Darker purple means more ducks. code
1.2 Starting position
Now, we know that the ducks come from the middle of the grass, but where exactly? Figure 1.4 shows the hitboxes starting position, using a sample of 1000 ducks. This graph basically displays the proportion of ducks who first appeared on this horizontal position. The computation was done on a pixel level.

Figure 1.4 – Horizontal pixel distribution of the ducks’ starting hitbox: the height shows the proportion of samples that started on that horizontal position. code
We see that the ducks come mostly from 2 areas: the left and the right.
- The left area is less popular and is more compact. In our sample, 39.9% of the ducks came from this area. We also get the highest peak at around the 60th pixel, with 33.8% of the hitboxes starting on these positions.
- On the opposite, the right area is more popular and less dense. 60.1 % of the ducks came from this area. The area is quite large, and with 104 pixels, it occupies 41% of the screen.
2. Ducks development over levels
What makes the levels much harder after the first one? There are mainly 3 reasons: speed, time and size.
Statistics were collected by continuously shooting (and missing) the ducks. A sample size of 1000 ducks was chosen again, but this time distributed on the 99 levels possible (code).
Interestingly, the 3 types of ducks


don’t differ in difficulty, even though they are worth a different number of points.
2.1 Duck speed
The most obvious increase in difficulty is the speed of the duck. Figure 2.1 shows the progression of the speed over the levels. On the first level, the average speed is around 55 pixels/second. For comparison, since the map is 256 pixels wide, it would take around 4.6 seconds to go from one end to the other.
What is insane is how much it goes faster: by level 8, the average speed is now twice the first level (around 109 px/s), and by level 12, the average speed of ducks is three times faster (around 162 px/s). At level 27 and beyond, the average speed stabilize at around 165 px/s, with peaks over 200 px/s.
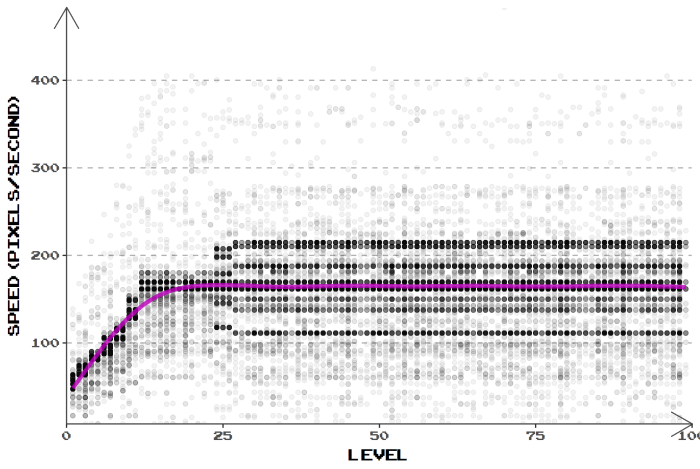
Figure 2.1 – Duck speed (in px/s) by level.
Speed was calculated by computing the position difference between midpoints of two consecutive hitboxes.
2.2 Flight duration
To add difficulty, the amount of time before the duck exits the screen gets constantly lower over the course of levels. This development is shown on figure 2.2. On the first level, we have in average 11.5 seconds to kill the duck. The speed constantly decrease until level 20, where the duration stabilize at 5.1 seconds. This is less than half the time we had on level 1.
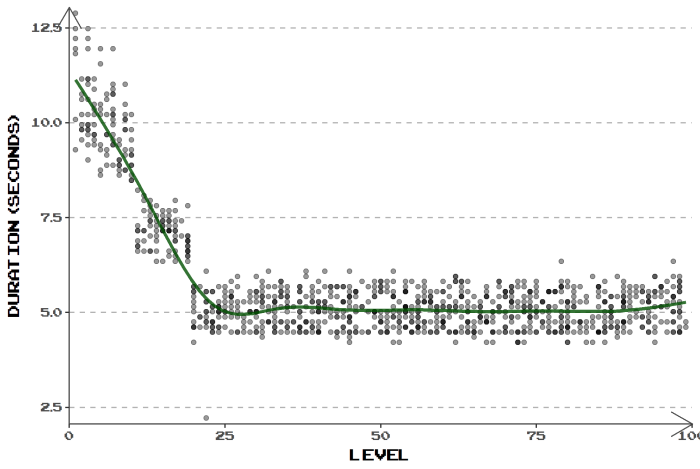
Figure 2.2 – Flight duration (in s) by level.
Duration was computed by counting the number of frames between the duck’s apparition and it’s disappearance.
2.3 Hitbox size
Although the actual ducks are always the same size, their hitbox sizes actual differs depending on their level and/or their direction. Now, if we look at figure 2.3, we get that on the first 23 levels, the hitbox is most of the time at 32×32=1024 pixels². From level 27 and onward, the average is almost half, at 591 pixel.
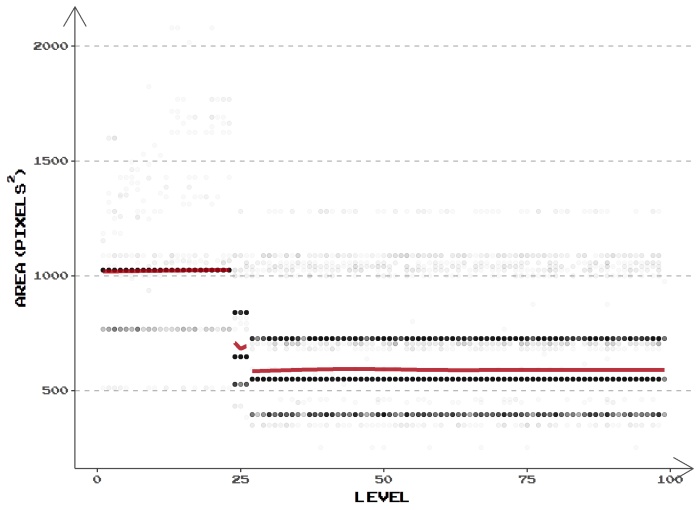
Figure 2.3 – Hitbox area by level (in px²).
Hitbox area was calculated by counting the number of white pixels when the zapper’s trigger was pulled.
Closing remarks
Today, we learned how duck hunt’s creators made their game increasingly difficult: increasing speed, but decreasing time and size (respectively ×3, ×½ and ×½ in the later levels). Curiously, all levels after 26 are technically similar, offering no added challenge. For the people patient enough to get to level 100, they get rewarded by accessing a glitch level.


I’m curious if you’d be interested in doing a similar style analysis for the Skeet Shooting game on the Duck Hunt cartridge. Specifically, i’m interested to find out where the difficulty stops increasing on that mode.